Bin Chicken Does Euro Summer: Species Distribution Modelling for the Sacred Ibis in Italy
My favourite bird in Australia is without a doubt the Ibis bird (scientific name: Bin Chicken). After leaving Australia, I was sad that I leaving this majestic bird behind. But then news have reached me that the bin chickens are enjoying Euro Summer like many Australians do. And what better place to go than Italy.
In this blog post, I will use Species Distribution Modelling to find out where are the best places to go if you want to see an Ibis in Italy. Following the brilliant tutorial on the Google Earth Engine website, but applying it to bin chickens in Italy. If you want to see the code behind this work, or you want to run this on another species in another country, then have a look at the Github Repo. Read this blog post for a fun read about Species Distribution.

Species Distribution Modelling 🌍
Species Distribution Modelling (SDM) tries to predict the distribution of a species across a geographical space. To do so, we combine environmental information about our area of interest and occurrence data of our species of interest. From remote sensing, we can get information about environmental variables, I used the Google Earth Engine and its huge data collection. Occurrence data, to my surprise, was not that hard to come by. There is GBIF where you can find occurrence data on basically any species.
What can Species Distribution Modelling be used for? Here, I will focus a bit more on invasive species such as the Ibis. SDM is used to derive a habitat suitability map that shows in which areas the environmental conditions are suitable for the species and where it would thrive. At the same time, it also shows unsuitable areas. This information can then be used, for example,e in 4 ways:
1) Forecasting Future Spread: When adding additional information on climate projections and urban expension scenarios, the model can predict how the habitat of the species changes in time. This helps conservation planners anticipate future threats to biodiversity and ecosystem function. 2) Impact on Native Species: Overlaying the ibis’s predicted range with sensitive habitats or known locations of native birds allows us to identify where competition or predation may occur. This can support evidence-based conservation decisions. 3) Rapid Response and Containment: In case of species that are newly observed in an area, the model can highlight other high-risk areas nearby. This supports targeted response strategies before the species becomes firmly established. (The ibis is well established in Northern Italy, and a rapid response is too late. Similarly to France. Spain, on the other hand, acted fast and culled the bird immediately to prevent damage to the local wildlife and crops.) 4) Management and Communication: Finally, suitability maps are compelling visual tools. They can help communicate risk to land managers, decision-makers, and the public.
Alright, so let me walk you through the steps to derive a habitat suitability map.
Occurrence Data 📍
First, we need data on where the species has been spotted. This is usually the biggest problem on any ecological project. If we had detailed information about where and how many animals of a species are, we could do so many cool things with it. Instead, we have to rely on whatever data we have. For invasive species or rare species, the data is generally sparse and, most importantly, opportunistic. The data from GBIF comes from birdwatchers, citizen scientists, or researchers during other studies. These reports vary in accuracy and coverage, but when aggregated, they paint a powerful picture of the species’ spread.
For my Ibis model, I used occurrence records from GBIF, which allowed me to map out where the Sacred Ibis has been recorded in Italy. See a short clip on the sightings and locations over the last 20 years.
Environmental Predictors 🌦️
Now that we know where to find the Ibis, the next question is why. This is where the environmental predictors come into play. Variables such as the climate, landscape and the vegetation all help to understand the ecological preferences of the species. Knowledge of the species can help with identifying important variables. The Ibis loves wetlands (elevation and slope data) and is a bird (Tree Canopy Cover). I decided to go with the following parameters:
1) Climatic Variables from WorldClim: I used bioclimatic variables (e.g. annual mean temperature, precipitation of driest quarter), which capture seasonality and extremes, not just averages. 2) Terrain Information: Elevation, slope, and aspect help identify low-lying wetlands or flat, open areas where ibises tend to forage. 3) Tree Canopy Cover (TCC): This is generally an important feature for birds because birds like trees for protection from predators.
Before doing the modelling, we reduce the number of variables. Most of the climatic variables will be strongly correlated, which can be tricky when training our prediction model. We sort out the strongly correlated variables using the Variance Inflation Factor. This reduces the multicollinearity.
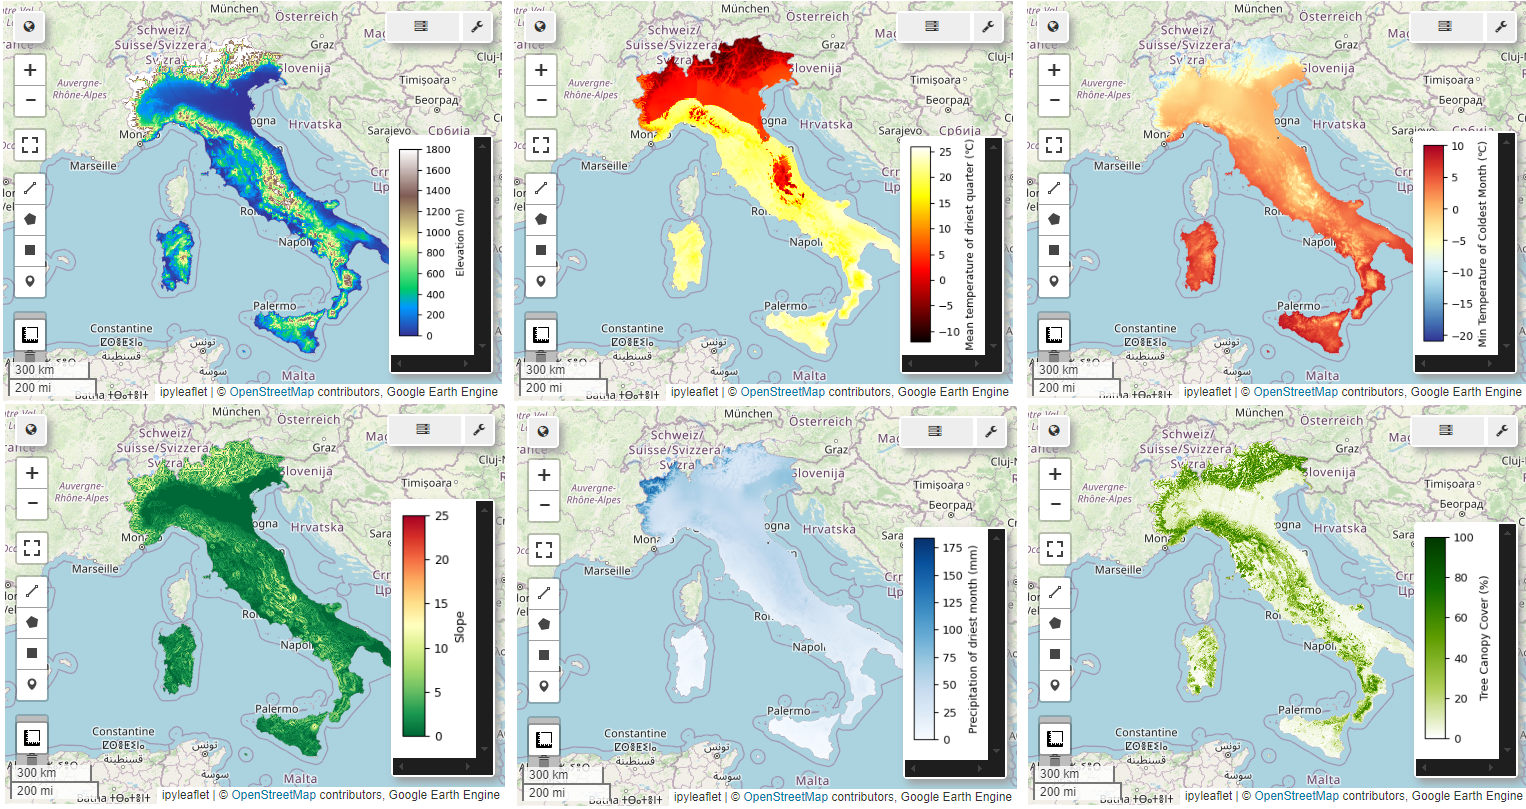
Below, I show the remaining 6 features to get a rough idea of Italy. From left to right, top to bottom, we have: *Elevation, Mean temperature of the driest month, minimum temperature of the coldest month, slope, precipitation, TCC)
Performing the SDM 🧪
Alright, let’s move on to the modelling. There are generally 2 approaches that we can take. The presence-background method requires only presence data and applies Maximum Entropy Modelling to derive an occurrence probability. The presence-absence data needs both presence and absence data. Absence data is hard to come by because it is hard to be sure where a species is absent. But the presence-absence method has the advantage that, besides the habitat suitability, it also gives feedback on how important each environmental variable is.
As we do not have absence, we need to simulate it and create what is called pseudo-absence data. This is a crucial part of the modelling. Basically, we use the presence data to train a K-Means algorithm to cluster the area into 2 groups: The ones that are similar to the presence data location and the dissimilar areas. To avoid overfitting, we only choose a small number of sightings (100ish) to train the model. The points are chosen semi-randomly. Generally random, but we want to ensure that they are somewhat spaced “equally” across the area.
The actual modelling is pretty easy. We have labelled data, i.e., presence and pseudo-absence data. Now we pick a number of random points from the presence and absence data to train the model and validate it. We use the Random Forest algorithm, which is fast and commonly used in the literature (Gradient Boosting algorithms, e.g. XGBoost, which are popular in the Machine Learning Community, could be used as well, but in most cases, the upsides of potentially higher accuracy are not worth the additional parameter tuning).
While training, we have to take into account spatial autocorrelation: Nearby points are generally strongly correlated than the ones further away. This can mess with the model. To reduce the impact, we use an approach called spatial block cross-validation. We make sure that the points that are used for training have a minimum distance from the testing points. This reduces spatial autocorrelation and makes our model more robust.
Without further ado, let’s present the results. Below, you can see the habitat suitability of the Ibis in Italy. Green means high suitability, and red means bad suitability. In black, the sightings are shown.
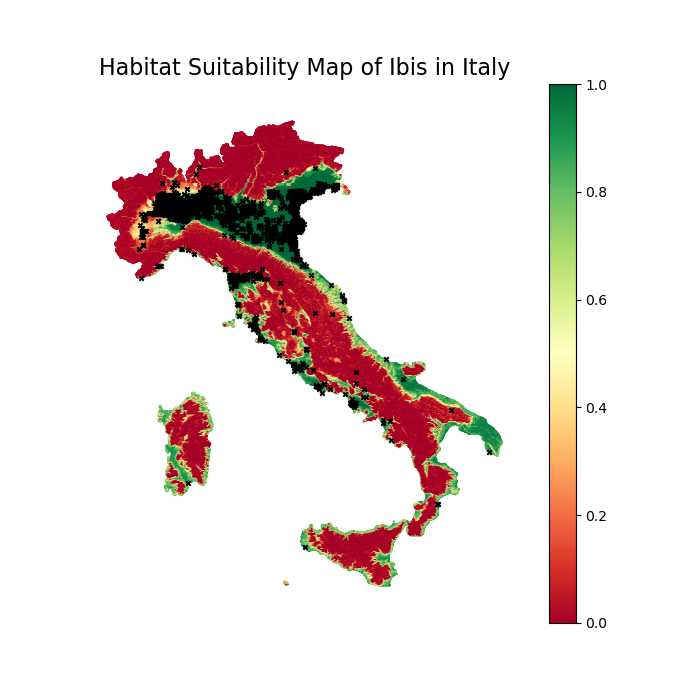
We can see that the Ibis likes flat areas and does not like the mountains. The northern flats of Italy are very popular with Ibis. With the most sightings and great suitability. Generally, the coastal areas are popular with the Ibis. Somehow, similar to Australians during Euro Summer. Generally, they prefer low altitudes without slopes. The tree canopy cover is not as important for the Ibis as it is for other birds. As the Ibis is quite big, most predators avoid it.
Final Thoughts 🧵
This project was really fun as it included my favourite bird in my neighbourhood. Turned out there was already similar research being done and published in Nature. So, we now have the technical skills to publish in Nature in 2021. Of course, the paper goes into much more detail about the Ibis, it’s history, how it got to Italy and more. But this is the great thing about a blog post. It does not need to be this extensive.
The biggest reveal was the GBIF platform for wildlife data. I thought it would have been really hard to come by presence data. Now with the basics of SDM, I can think about some more involved topics. The plan was to have an additional part on how the climate will affect the habitat of the Ibis, but as the most important factor for the habitat was the elevation and slope, I think climate projections will not affect the habitat much. But maybe I will do this in a future project.