Unravelling the Secrets of Sydney's Most Elusive Beach: How to predict the appearance of MacKenzies Bay's Beach using Satellite Imagery
There is a mysterious beach in Sydney that only appears every 7 years according to folklore. I saw this as the perfect opportunity to use some satellite data and play space detective. The perfect opportunity to whip out some satellite data and play space detective 🕵. Armed with the Python package CoastSat, which automates the tracking of beach shorelines from satellite data. This is complemented with wave data from the Manly Hydraulic Lab.

The beach in question? MacKenzie Bay, tucked away in the eastern suburbs of Sydney. It occasionally shows up during late spring, early summer for a couple of months. When and why it shows up is still a bit unclear.
According to a recent article, the beach only forms when the conditions are just right and there is enough sand in the bay.
They say it’s impossible to predict when it’ll appear next. I say: challenge accepted.
Waves & Sand 101 🌊
I’m no coastal engineer, so let’s keep this simple. Here’s all the ocean-sand science you really need for this beach mystery:
- Big waves pull sand from the beach and dump it into the ocean.
- Small waves gently push sand from the ocean back to the beach.
That’s it. That is all we need to know. Real coastal dynamics are much more complicated than this, but these two assumptions are enough to guide our analysis.
To see this in action, check out this quick YouTube Simulation.In the first 25 seconds, big waves steal sand from the beach to build an underwater sandbank. Later, smaller waves come in and politely return the sand to shore.
Folklore about 1997 🤫
Let’s start with a bit of folklore. Allegedly in 1997, there was so much sand was dumped at the MacKenzie Bay that you were able to walk all the way to Bondi. I wish I could end that debate but unfortunately in 1997 there was only 1 satellite capturing publically available images, which only visited Australia once or twice per month. If it is cloudy during that time the images are useless. The best image from that time can be seen below.
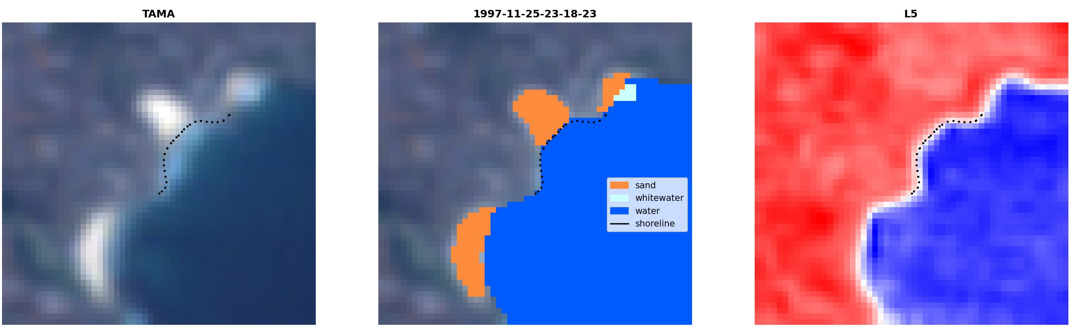
The more recent Landsat 7 and 8 or Sentinel-2 deliver higher resolution images.
Mapping the Coastline 🏖️
The real hero of this analysis is the CoastSat package, which made the image extraction and shoreline identification a walk in the park. Like, I only had to provide the dates and coordinates, draw 1 line, and the package did all the rest.
There was only 1 problem.
The beach at MacKenzie Bay tends to be tiny like often less than 5m wide, so smaller than the resolution of even the newer satellites. Luckily, only a few hundred metres away is another (permanent) beach, Tamarama. Tracking the size of Tamarama Beach, we can assess how much sand is around in the bay.
However, this also meant that I had to go through the images by hand without automation. It was one of those “faster to do it yourself” scenario where it is faster to do the classification yourself than training a model. I clicked through roughly 2000 images and found 10 instances where there was sand at MacKenzie Beach.
Below, you can see the result: I plotted the length of Tamarama Beach in yellow, and marked the periods where the mystery beach made an appearance in green.
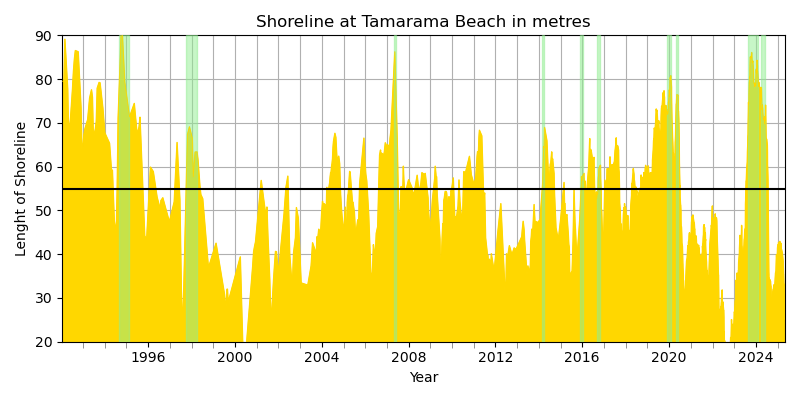
We can see that the mystery beach only appears if the beach in Tamarama is longer than 55m. This will be the first condition for the beach to appear at MacKenzies Bay to appear.
Let’s try and figure out why there can be a lot of sand at Tamarama, but no beach a few hundred metres away at MacKenzies Bay.
Listening to the waves 🌊
Next, we inspect the historical wave data captured by buoys out in the sea. I looked at the [significant wave height]https://en.wikipedia.org/wiki/Significant_wave_height) and the wave energy (a combination of wave height and wave period), but wave height had a stronger correlation with the data. So we are using this for the next conditions. I grouped wave heights into 3 (very scientific) categories:
- Big: Larger than 3.5m
- Huge: Larger than 4m
- Massive: Larger than 5m
These thresholds are a bit arbitrary. I just eyeballed the data distribution and picked cutoffs that gave me a nice spread of wave events.
The usual tools to use for time-series analysis are rolling averages (also called moving average) or time lags, i.e., how the conditions were, let’s say 1 or 2 days ago. But a much simpler feature has proven to be the best predictor:
days_since_event: the number of days since a “Big”, “Huge”, or “Massive” wave hit.
First result, I can confirm that the beach disappears after big, huge or massive waves hit the coast. Or, I should say the beach is destroyed instead of disappearing.
So, we found the culprit behind the disappearance of the beach.
When does the beach show up? 🏖️
Alright, here’s the moment we’ve all been waiting for: can we predict when MacKenzie Bay decides to pop out of hiding?
By combining the wave data with the shoreline lengths, I came up with a simple recipe that predicts the beach’s appearance about 70% of the time. These are the 3 conditions that have to be met:
- 55 m+ beach length in Tamarama.
- No waves larger than 5m in the last 3 months.
- No waves larger than 3.5m in the last 3 weeks.
Below is a timeline showing when these conditions were not met (blue), when they were met (white), and—highlighted in gold—when the mysterious beach actually appeared.
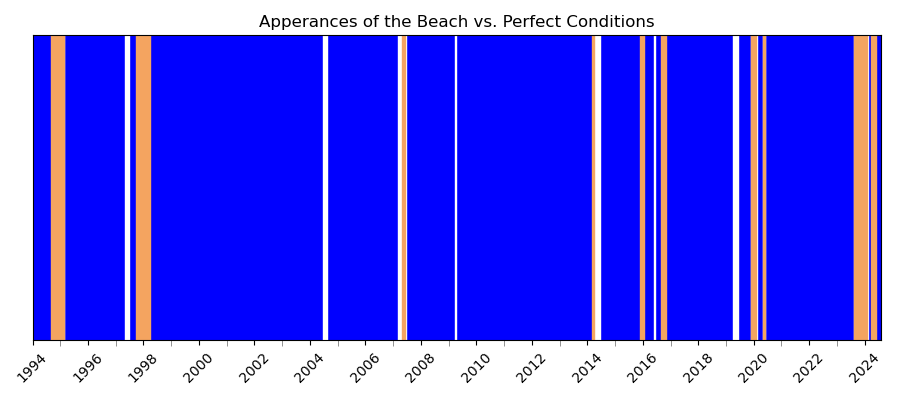
Out of 15 times when all three conditions lined up, the beach showed up 10 times, giving us a tidy 66.6% accuracy.
Sure, it’s not perfect, but hey—better than “totally impossible,” right?
Final Thoughts 💭
That big claim—that predicting when the beach appears is totally impossible? Turns out, it’s a bit of an overstatement.
By combining satellite images and wave data, I came up with clear conditions that mostly predict MacKenzie Bay’s appearance. There are probably still 1 or 2 bits missing to get a higher accuracy, but we put in almost zero understanding of coastal dynamics.
What’s missing? Probably better shoreline data cleanup. Correcting for tides could help to better calibrate the first conditoin. Wind, currents, and wave direction might also be key players. I did filter out waves coming from “protected” directions (too much north), but it could be that Eastern swells carry sand in front of the bay along the coast instead of towards the coast.
Overall, I’m pretty happy with the results. I was secretly hoping for even higher accuracy, but also braced myself to find zero correlation. So hey, this is a win.
If you’re eagerly waiting for the beach to return, here’s the strategy: count the days since the last massive swell. And place a marker at Tamarama Beach to indicate when the first condition is met.